How to Measure Anything - by Douglas Hubbard
ISBN: 978-1118539279
READ: June 14, 2020
ENJOYABLE: 7/10
INSIGHTFUL: 10/10
ACTIONABLE: 10/10
Anything that can be observed can be measured. Things like "employee empowerment", or "creativeity" must have observable consequences if they matter at all.
If you know almost nothing, almost anything will tell you something.
In many companies, intangibles (ie. "flexibility to create new products") are assumed to be immeasurable so decisions are not well informed. Companies skip over investments where benefits are "soft" and considered immeasurable, such as "premium brand positioning" or "improved word of mouth advertising" in favor of minor cost saving ideas because they are easy to measure. Conversely, key strategic principles or core values of companies (ie. "improving customer relationships") are treated as a "must have" so they get investment regardless of the degree to which those investments had measurable effectiveness.
If the outcome of a decision is highly uncertain and has significant consequences, then measurements that reduce uncertainty about it have a high value.
ie. "Where should investments be made to improve developer productivity?"
Illusion of intangibles
Three reasons people think something can't be measured:
- Definition of measurement is widely misunderstood.
- The thing being measured is not well defined.
- Many procedures of empirical observation are not well known.
Definition of measurement = a quantitatively expressed reduction of uncertainty based on one or more observations.
Measurement does not need to be infinitely preciese. In fact, lack of reported error means it's not really a proper measurement at all.
If someone asks how to measure "strategic alignment", ask "what do you mean?" Once you figured out what something is, it becomes a lot easier to measure.
If it matters at all, it is detectable/observable. If it is detectable, it can be detected as an amount or range of possible amounts. If it can be detected as a range of possible amounts, it can be measured.
If you can identify even a single observation that would be different between an organization with greater or lesser "employee empowerment", then you are on your way to measuring it.
Rule of five = 93.75% chance that the median of a population is between the smallest and largest values in any random sample of five from the population
No matter difficult or unique your measurement problem seems to you, assume it has been done already by someone else, perhaps in another field if not your own. I've noticed that there is a tendency among professionals in every field to perceive their field as unique in terms of the burden of uncertainty. The conversation generally goes something like this: "Unlike other industries, in our industry every problem is unique and unpredictable," or "Problems in my field have too many factors to allow for quantification."
Don't assume that the only way to reduce uncertainty is to use an impractically sophisticated method. Think of measurement as iterative. Start measuring it. You can always adjust the method based on initial findings. Examples:
School wanted to measure online teacher performance. They defined sampling methods that allowed managers to select recordings of sessions and particular slices of time, each a minute or two long, throughout a recorded session. For those randomly chosen time slices, they could sample what the teacher was saying and what the students were doing.
Cleveland Orchestra wanted to measure whether performances were improving. Many business analysts might propose a repeated randomized patron survey. But the orchestra started counting the number of standing ovations.
Defining what you want to measure
Define the problem. What is your dilemma?
If managers can't identify a decision that could be affected by a proposed measurement and how it could change those decisions, then the measurement has no value.
Managers say some measurement helps make decisions without specifiying any particular decision. Managers say they need to measure something, without being able to state what they would change if they knew more about that something.
Requirements for a decision:
- must have two or more realstic alternatives, ie. build or not
- has uncertainty (lack of complete certainty... the existence of more than one possibility)
- potentially negative consequences if you took the wrong position
- has a decison maker and maybe many stakeholders
- can be one big thing or many little things
Measurement of uncertainty = set of probabilities assigned to a set of possibilities, ie. "there is a 60% chance that this market will double in five years"
Doug was tasked with identifying performance metrics for various security-related systems being proposed for the VA. Previous approaches focused on activities like counting the number of people who completed training courses, number of desktops that had certain systems installed. These efforts were focused on what was considered easy to measure, but wasn't measuring results at all. Doug asked: "What do you mean by IT security? What does improved IT security look like? What would we see or detect that would be different if security were better or worse?" Turned out they wanted to evaluate whether any of the proposed investments were justified. Realized that better security means observing a reduction in the frequency and impact of security incidents.
This is so similar to developer velocity!
Confidence interval = a range that has a particular chance of containing the correct answer, ie. 90% confidence interval is a range that has a 90% chance of containing the correct answer.
Calibration training = helping estimators understand whether they are overconfident or underconfident
Could calibration training be productized?
It is better to be approximately right than to be precisely wrong. –Warren Buffet
Studies have shown that it is quite possible to experience an increase in confidence about decisions and forecasts without actually improving things.
Monte carlo simulation uses a computer to generate a large number of scenarios based on probabilities for inputs.
Expected value of information = reduction expected opportunity loss (EOL), ie. EVI = EOL (before info) - EOL (after info)
How to measure
Decomposition = breaking down a measurement problem into constituent parts that can be directly observed
To measure... do forensic analysis of data you already have... follow the trail. Use direct observation, start looking, counting, and/or sampling if possible. If there's no trail, add a "tracer" so it starts leaving a trail. If you can't follow a trail at all, create the conditions to observe it (an experiment).
Do a random sample for surveys
Removing names from essay tests graded by teachers removes possible bias a teacher might have about students. In clinical research studies, neither doctors nor patients know who is taking a drug and who is taking a placebo.
Can this be incorporated into dx? Anonymize reviews or code for tagging?
Definitions:
- systemic error/bias = a consistent bias or inherent tendency of a measurement process to favor a particular outcome
- random error = inconsistent, unpredictable error
- accuracy = low systemic error (consistent bias), AKA "validity"
- precision = low random error, AKA "reliability" or "consistency"
A method to reduce either systemic or random error is a "control".
Random sampling is a control because random effects, while individually unpredictable, follow predictable patterns in the aggregate, ie. you can't predict a coin flip, but you do know that there'll be 500+/-26 heads if you flip 1,000 times. Systemic errors are much harder to compute an error range for.
In business, people often choose precision with unknown systemic error over a highly imprecise measurement with random error.
Example: to determine how much time sales reps spend in meetings... time sheets have error, esp those turned in at 5pm on Friday... it is better to directly observe a random sample by checking random reps at random times of day to see if they are in customer calls than to review all timesheets. Random sampling provides a range, but this is preferable. However, if you merely want to measurew the change in time spent, then systemic errors may not be relevant.
Additional types of biases:
- expectancy bias: observers sometimes consciously or unconsciously see what they want (hence, double blind placebo test)
- selection bias: even when attempting randomness in samples, we can get inadvertent nonrandomness
- observer bias: act of observing a population causes change in behavior. simplest solution is to keep observations a secret from those being observed
Sampling
A test of every single item in a group you want to learn about is a census (ie. monthly inventory, balance sheet). Anything short of a complete sensus of the population is a sample.
It seems remarkable that looking at some things tells us anything about things we aren't looking at, but this is what most of science does, ie. speed of light was determined with some samples of light, not all light.
Everything we know from "experience" is just a sample. We didn't experience everything; we experienced some things and we extrapolated from there. This is all we get – fleeting glimpeses of a mostly unobserved world from which we draw conclusions about all the stuff we didn't see. Yet people are confident in the conclusions they draw from limited samples... because experience tells them sampling works.
Random sampling = each item in the population should have same chance of being selected.
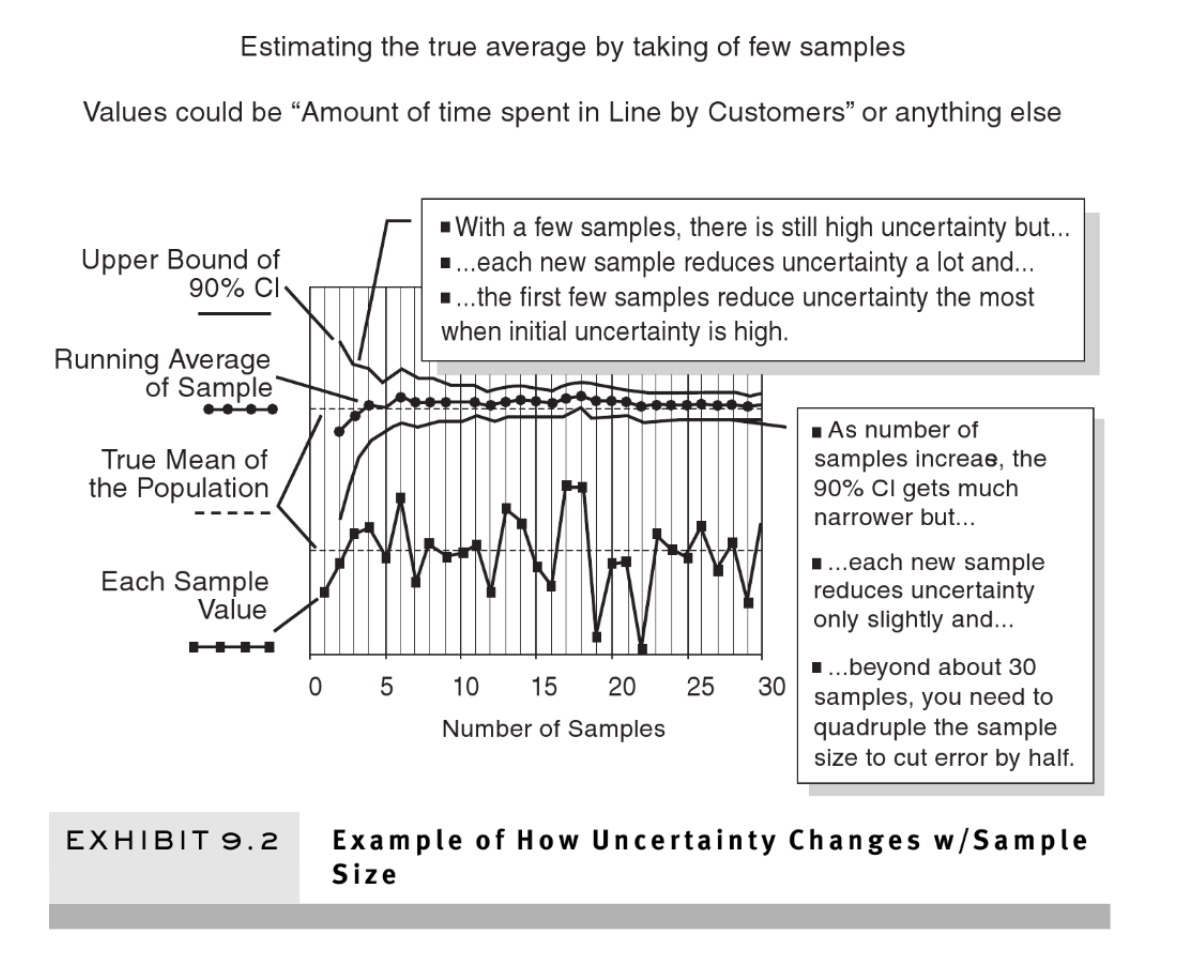
When your current uncertainty is great, even a small sample can produce a big reduction in uncertainty. This book is about things that are considered immeasurable, and in those cases, the initial uncertainty is generally great. And it is exactly in those types of problems where even a few observations can tell us a lot.
Exercise: what is your 90% CI for the weight of the average jelly bean? write it down. Now suppose the weight of bean #1 is 1.4 grams. Then the next sample weights 1.5 grams. Then the next three are 1.4, 1.6. an 1.1.
Shows the power of small samples and ranges.
Whether a finding is stastically significant is not the same thing as whether your current state of uncertainty is less than it was before. People appear to believe that stasticial significant is some standard of legitimacy they should be concerned with.
Asking calibrated estimators for subjective estimates is very useful and has some advantages over traditional statistics.
"z-score"/"normal statistic" was developed to estimate CI based on random sample of 30+. "t-statistic" allows for smaller samples. Curve becomes similiar to z-score once sample is 30+.
Both the z-scores and t-scores tell you how many standard deviations something is from the mean value. The z-distribution is the “standardized” normal distribution. The normal distribution is the familiar bell-shaped curve, symmetric, with almost all of the data falling within three standard deviations around the mean (Empirical Rule). For example, z = 1.5 tells you that the value is 1.5 standard deviations greater than the mean value. The t-distribution is also symmetric and mound shaped but its exact shape depends on the sample size. If the sample size is large (think 1,000 plus) then the z and t distributions are essentially the same. With smaller samples the t distributions has “fatter tails” and is more shallow and flat (compared to z). The t distribution is appropriate with continuous data when you do not know the population standard deviation (most real world cases).
Big payoff in information tends to be early in the information gathering process. On average, increasing samplze size will decrease size of interval... but with decreasing return, ie. once you get to 30 samples, you have to ~quadruple the number of samples if you want the error to go down by half again.
Sampling methods
Recatch method = sample a population, release, then resample the population to estimate the size of the population. ie. to estimate the number of flaws in a building design, use two different groups of quality inspectors then compre how many each caufght and how many were caught by both teams.
Population proportion sampling = estimate what proportion of a population has a particular characteristic
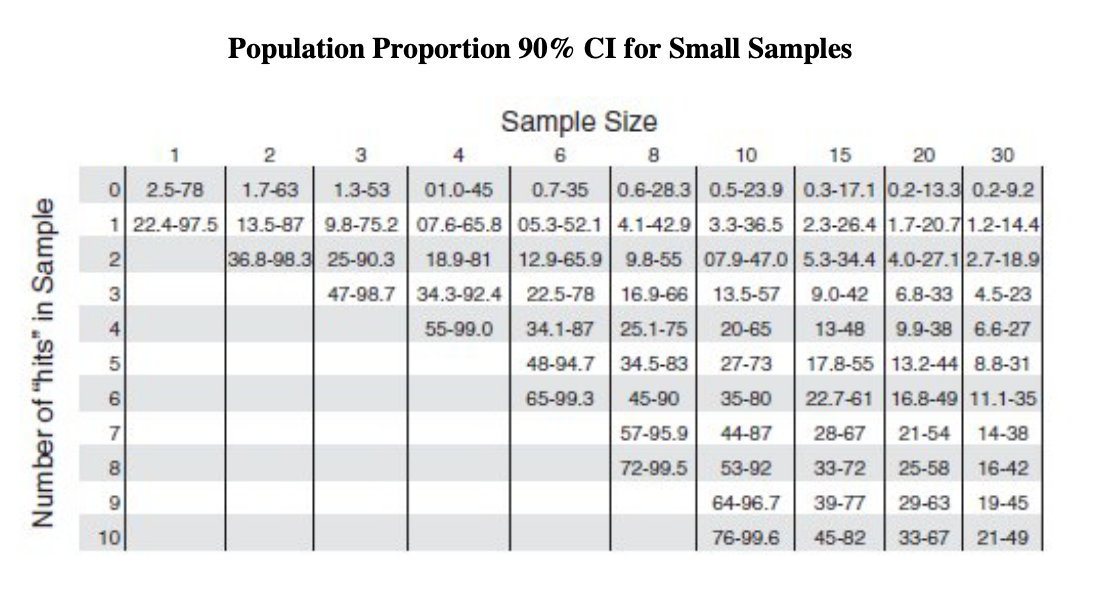
Spot sampling = Variation of population proportion sampling. Taking random snapshots of people, processes, or things instead of tracking them constantly throughout a period of time. ie. to track share of time employees spend in a given activity, randomly sample people through the day to see what they are doing at that moment. If you find that in 12 instances out of 100 random samples, people were on a conference call, you can conclude they spend about 12% of the time on conference calls (90% CI is 8% to 18%).
Productize this?
Serial sampling = taking serail numbers to estimate production levels
Also look into clustered sampling and stratified sampling.
Outliers
t-statistic and z-statistic are types of "parametric" statistics, meaning they make some assumptions about the underlying distribution.
"power law" distributions have no definable mean.
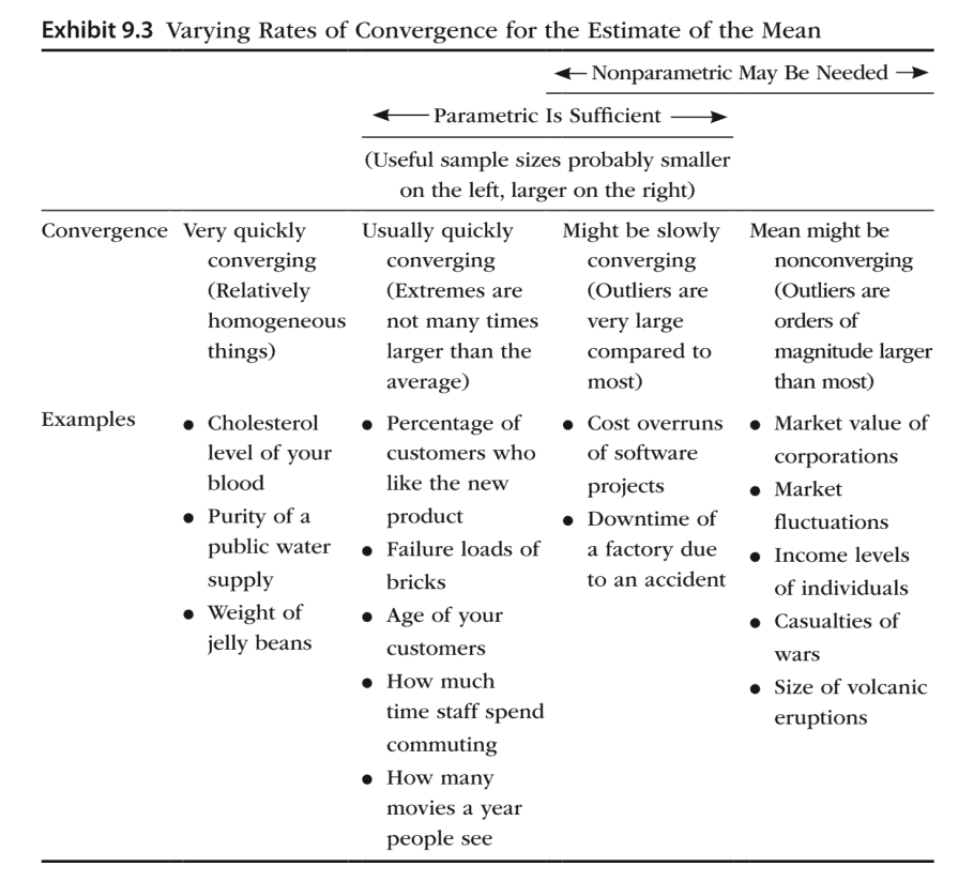
If we sample income levels of individuals or the power of an earthquake, or the size of asteriods, we may find that 90% CI does not necessarily get narrower as sample size increases. Some samples will temporarily narrow the 90% CI, but some outliers are so much bigger that if they came up in the sample, they would greatly widen the CI.
Easiest way to determine how quickly estimates converge is to ask: "How big are the exceptions compared to most?"
ie. Reality-tv watching time is likely a highly skewed population with a lopsided distribution, meaning the median and mean can be different values. Estimating the median avoids the problem of nonconverging estimates.
Nonconverging data can be a challenge, especially with small samples. ie. Imagine surveying customers about how many hours per week they spend watching reality TV (their answers 0, 0, 1, 1, and 4. Spreadsheet would show lower bound as a negative value, which makes no sense.
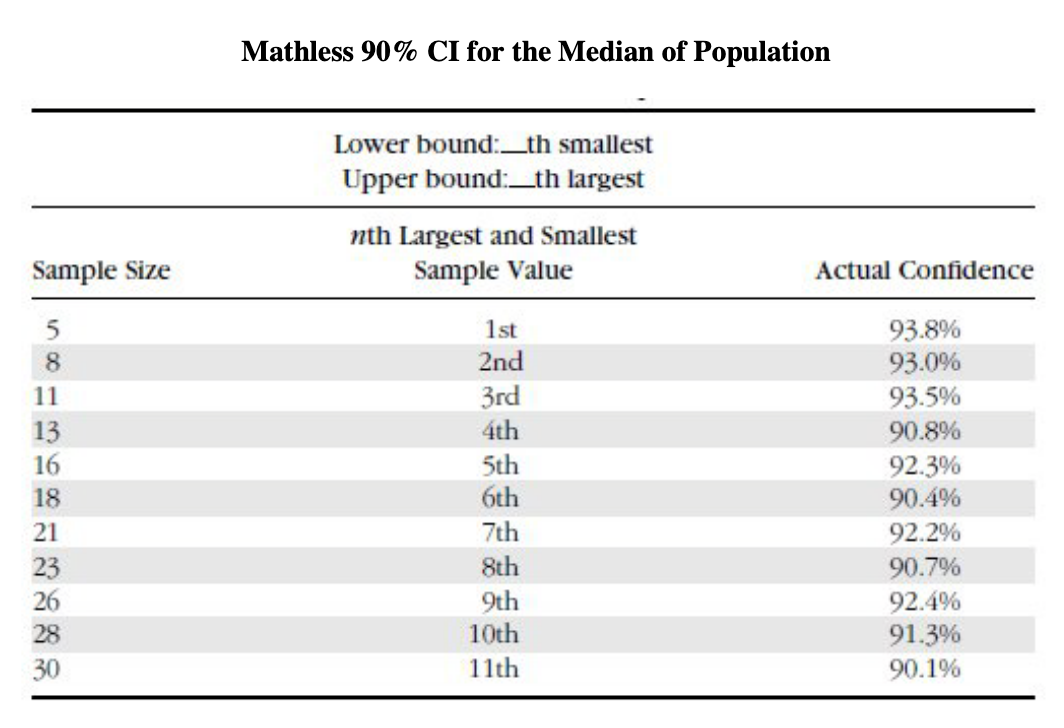
"Power law" distributions can still be measured using "nonparametric" methods.
"mathless median" similar to the "rule of 5":
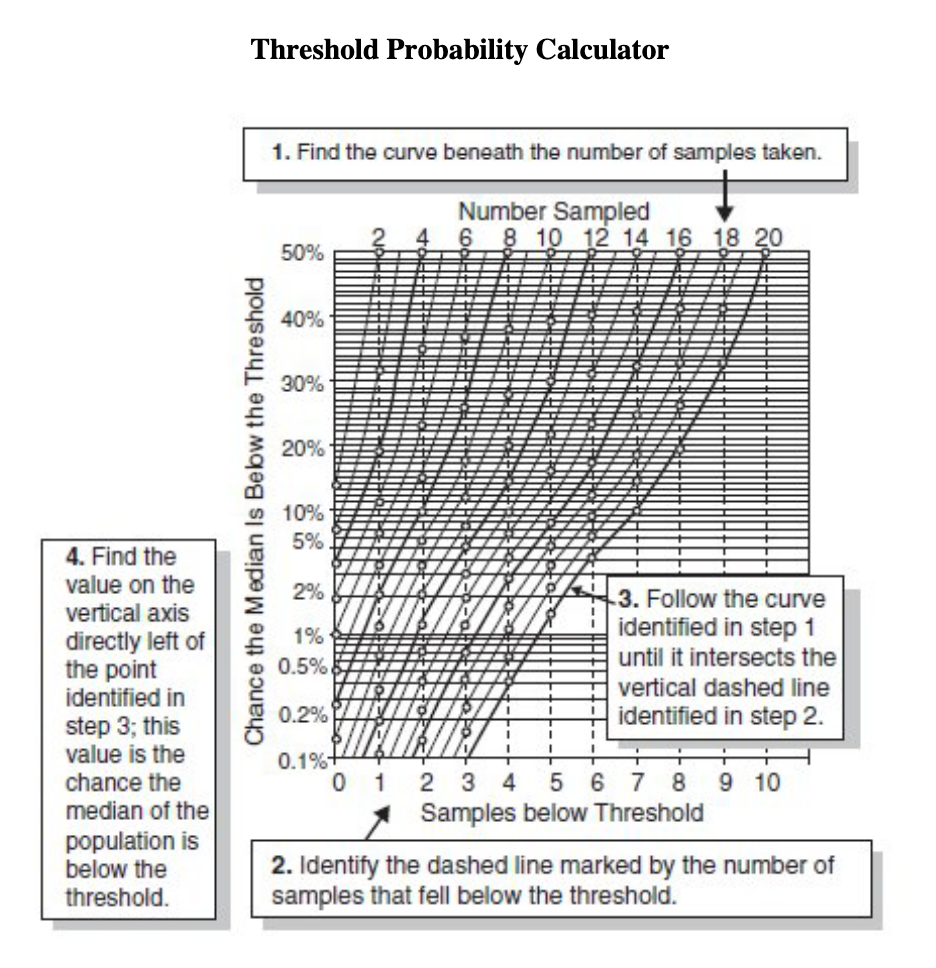
Threshold probability
Uncertainty about the threshold can fall much faster than the uncertainty about the quantity in general.
How to esimate the chance that the median of a population is on one particular side of a threshold:
If we change a feature on a product and want to determine how much this affects customer satisfaction, we might need an experiment using a test group, control group, and baseline.
Productize "experiments" similar to A/B tests in Optimizely? Developer satisfication based on referring a friend? Like NPS?
Statistical significance
Statistical significance is not "what is the probability that the drug works?". It is "given that what we observed was a fluke, what is the chance we would observe this difference or an even bigger difference?"
If the p-value is less than some previously stated threshold–ie. 0.01– then they reject the null hypothesis.
Significance testing is an artifact of the previously-mentioned frequentist view of probability. This definition of probability–an idealized frequency limit of a purely random, strictly repeatable process over infinite trials–is virtually impossible to apply to real-world problems like the probability of the success of a new product or effectiveness of a new drug.
Terms related to statistical significance:
- Null hypothesis = results are a random fluke
- Alternative hypothesis = results show a real phenomenon
- p-value = the chance of seeing the observed phenomenon
- significance level = some chosen value, based only on convention and tradition in the particular field, that p-value must be less than in order to reject the null hypothesis
- "Statistically significant" = P-value < significance level
We can easily imagine practical situations where a statistically significant result would have an information value of zero. We simply imagine a situation where no result could have changed the outcome of a decision.
Correlation between two sets of data is expressed as a number between +1 and -1.
Regression = method of estimating correlation.
Biggest mistake is assuming correlation proves causation. Second mistake is assuming correlation isn't evidence of causation.
Measuring preference and attitudes
A lot of managers feel that concepts such as "quality", "image", or "value" are immeasurable because they can't find what they feel to be "objective" numbers.
This is a mistake of expectations. All quality assessment problems are about human preferences, and human preferences therefore must be the source of measurement.
Measuring preferences, attitudes, and values are part of the field of psychometrics.
There are two ways to observe preferences, what people say (stated preferences) and what people do (revealed preferences).
If we use a questionnaire to ask people what they think, we are making an observation where the stastitcal analysis is no different from how we analyze "objective" physical features. Four common types of questions: Likert scale, multiple choice, rank order, open ended.
Strategies for avoiding response bias (when a questionnaire affects respondents' answers):
- Keep the question price and short.
- Avoid loaded terms with a positive or negative connotation.
- Avoid leading questions that tell the respondent which particular asnwer is expected.
- Avoid ocmpound questions, ie. "do you prefer the seat, steeing wheel, and controls of Car A or B?""
- Reverse questions to avoid response set bias (tendency of respondents to answer questions in a particular direction regardless of content, ie. having the same 1 to 5 scale).
Partition dependence = partitioning of multiple choice options effects rate at which an option is chosen.
If you can correlate two things to each other, and then if you can correlate one of them to money (or another "objective" quantity), then you can express them both in terms of money.
ie. to measure happiness, Andrew Oswald didn't ask people how much they were willing to pay for happiness. Instead he asked them how happy they are according to a Likert scale, and then asked them to state their income. This allowed Oswald to correlate income to other factors, ie. he found that a lasting marriage makes a person just as happy as earning another $100,000 per year.
Could this be done for DX?
WTTP = "willingness to pay" = method of valuing things by seeing how much people are willing to pay.
Quantifying performance
I know what to look for, but how do I total all these things?
Terms like "performance" and "quality" are used ambiguously. Generally, clients can provide a list of separate observations they associate with performance (ie. "gets things done on time", "gets positive accolades from clients", "error-free modules completed per month") but don't know how to consolidate it into a single measurement.
This is a problem of how to tally lots of different observations in a total "index" of some kind.
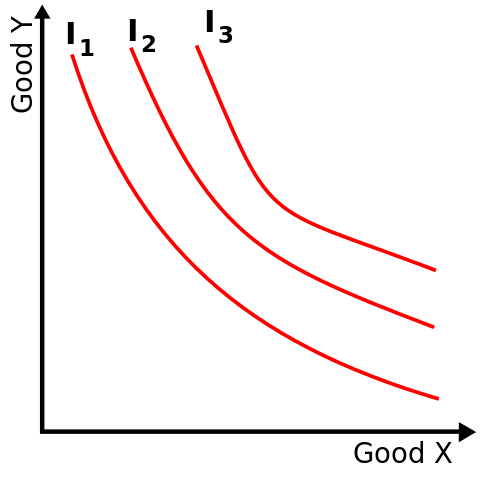
One method is a utility (or "indifference") curve which equalizes two measurements:
Another method is to collapse different considerations into a "certain monetary equivalent (CME)". CME of an investment is the fixed and certain dollar amount that someone considers just as good as the investment.
Could be used to combine multiple parameters describing quality into one monetary quality value.
What does performance mean if not a quantifiable contribution to the ultimate goals of the organization? Try to reduce factors down to the ultimate goal, ie. profit or shareholder value maximization problem. Examples of how people defined some form of "performance" as a quantifiable contribution to some ultimate goal:
- Management consultant measured performance in colleges by making financial health the ultimate measure. He computes a type of financial ratio for each program, department, or professor; compares them to other institutions, and ranks them.
- CIO computes "return on management" by dividing "management value added" by the salaries, bonuses, and benefits of management. Management value added is calculated by subtracting from revenue the purchases, taxes, and other items outside of what management controls.
- Manager of Okland A's threw out traditional stats and decided that most important offensive measure chance of not getting an out, and for defense was "out production". Each of these contributed to the measure of what a player contributed to the chance of a team winning a game relative to his salary. At a team level, this converts into a simple cost per win.
The ultimate measurement instrument: human judges
Human mind has remakable advantages over mechanical measurements for assessing complex and ambiguous situations. Tasks such as recognizing one face or voice post great challenges for software but are trivial for a five-year-old.
We need to exploit the strengths of the human mind as a measurement instrument while adjusting for its errors.
Cognitive biases:
- Anchoring: Simply thinking of one number effects the value of a subsequent estimate even on a completely unrelated issue. ie. asking two groups "Is it more than __?" then asking for a specific estimate – the average estimates were different.
- Halo/barns effect: If people first see one attribute that predisposives them to favor one laternative, they are more likely to interpret additional information in a way that supports their conclusion. ie. making judgements after first impression.
- Bandwagon bias: If you need something measured, ask people individually.
- Emerging preferences/"choice blindness": preferences change based on a change of favored option.
Linear models
Weighted scores are one way to estimate relative items like "buusiness opportunities".
Simple linear models outperform human experts in many cases.
Normalized z-score outperforms linear weight scoring methods because it solves inadvertent weighting, ie. if one criteria is always a 4 out of 10, then another criteria that varies more will be weighted more highly.
"Invariant comparison" principle says that if one measurement instruments says A is more than B, then another measurement instrument should give the same answer. ie. someone may do better on one IQ test than another.
Another version of invariant comparison = when there are too many individuals for each judge to evaluate so they are divided up among the judges. ie. if you wanted to evaluate proficiency of project managers based on their performance on various projects... variance in grading style of judge and difficulty of project would mean the comparison of PMs would not be invariant of who judged them or the projects they were judged on.
Rasch model = predicted chance that a subject would correctly answer a true/false question based on (1) the percentage of other subjects in population who answered it correctly, (2) the percentage of other questions that the subject answered correctly. This can be used in the PM scenario to remove variance due to judges and project difficulty.
Lens model: uses implicit weights derived from decision makers to crete a formula. Experts know what to look for but can apply it with great inconsistency.
Could this be productized for engineering performance reviews?
A disturbing trend in management is to develop a type of weighted score where the score and weight are both subjective scales with arbitrary point values, ie. for rating a proposed project via 1 to 5 rating in categories such as "strategic alignment" and "organizational risk". These introduce additional errors for six reasons:
- Ignore partition dependence. Arbitrary choices about where to draw the line between values can have large effects on responses.
- Scores are used in place of actual quantitative measurements.
- Research has shown that ambiguous labels (1 to 5 scales) are interpreted very different differently, creating the "illusion of communication".
- Scores can be revealing if they are part of a group survey but are less so when individuals use them to "evakuate" options. People are rarely surprised by scores they applied themselves.
- Scores are ordinal... a higher score means "more" but doesn't say how much more.
- Ordinal scales introduce "range ciompression"... the riskiest item in "medium" can be many more times riskier than the least risky item in the same category but clustering responses in a way that hides the difference.
When experts select weights on a scale of 1 to 5, it's not necessarily clear that they ineterprent a 4 to mean twice as important as a 2.
Prediction markets
GE uses prediction markets to measure the probability that different innovations proposed by employees would be marketable. One useful way to apply prediction markets is to bet on a threshold, ie. "Product X will generate more than $25 million revenue in the first 12mos."
https://www.consensuspoint.com is a vendor helping businesses with prediction markets.