Accelerate - by Nicole Forsgren, Jez Humble, and Gene Kim
ISBN: 978-1942788331
READ: October 22, 2020
ENJOYABLE: 8/10
INSIGHTFUL: 9/10
ACTIONABLE: 7/10
- Forrester (Stroud et al. 2017) report found that 31% of the industry is not using practices that are widely considered necessary for accelerating technology transformations, ie. CI/CD.
- Gartner study found that 47% of CEOs face pressure from their board to digitally transform (Panetta 2017).
- Forrester report states that organizations often overestimate their progress (Klavens et al. 2017) and that executives are especially prone to overestimating their progress when compared to those who are actually doing the work.
... the potential for value delivery and growth within organizations is much greater than executives currently realize... [and] makes clear the need to measure DevOps capabilities accurately and to communicate these measurement results to leaders, who can use them to make decisions and inform strategy about their organization's technology posture.
Capability models
Maturity models focus on helping an organization "arrive" whereas capability models focus on helping an organization continually improve and progress, realizing that the tech and business landscape is ever-changing. The most innovating and highest performing organizations are always striving to be better and never consider themselves "mature" or "done" with their improvement.
Our research and data confirms that industry is changing and what is good enough or "high performing" today is no longer good enough in the next year.
How are new capabilities being continually researched and included in the model?
Capability models are multidemonsional and dynamic, allowing different parts of the organization to take a customized approach to improvement, and focus on capabilities that will give them the most benefit based on their current context and their short- and long-term goals.
Product vendors favor capabilities that align with their product offerings. Consultants favor capabilties that align with their background, their offering, and their home grown assessment tool... A more guided, evidence-based solution is needed...
Our research identifies capabilities which enable software delivery and organizational performance as seen in profitability, productivity, and market share.
From HTMA: "what does performance mean if not a quantifiable contribution to the ultimate goals of the organization? Try to reduce factors down to the ultimate goal, ie. profit or shareholder value maximization problem."
The things that do make a difference in the success of SDO are those that the highest performers and most innovative companies use to get ahead... These capabilities are easy to define, measure, and improve.
How is the weighting of capabilities determined?
Measuring performance
Measuring performance in software is hard because the inventory is invisible.
Attempts to measure performance have suffered from two drawbacks, 1) focusing on outputs rather than outcomes, 2) focusing on individual measures rather than team or global ones.
Lines of code - rewarding developers for LOC leads to bloated software that incurs higher maintenance costs and higher cost of change.
Velocity - designed to be used as a capacity planning tool. Velocity is relative and team-dependent, not absolute. When velocity is used as a productivity metric, teams inevitably work to game their velocity.
Utilization - high utilization is only good up to a point. Queue theory intells us that as utilization approaches 100%, lead times approach infinity.
A successful measure should have two key characteristics:
- Focus on global outcome to ensure teams aren't pitted against each other.
- Focus on outcomes not output: it shouldn't reward people for busywork that doesn't help achieve organizational goals.
Settled on four measures software delivery performance:
There are frequent references to Lean theory and metrics.
- Lead time: time it takes to go from code committed to code successfully running in production. Shorter lead times enable faster feedback on what is being built and allow for course correcting more rapidly.
- Deployment frequency: how often code for primary service is deployed to production. Proxy for batch size: reducing batch sizes reduces cycle times and variability in flow, acceleraters feedback, reduces risk and overhead, improves efficiency, increases motiation and urgency, and reduces costs and schedule growth (Reinertsen 2009, Chapter 5).
- Mean time to restore (MTTR): time it takes to restore service.
- Change fail percentage: percentage of changes to production which fail.
Code committed is ambiguous because it can mean different things (ie. code committed locally, code pushed, code reviewed and commited into main branch)
The book discusses what lead time is and why it is good, but does not explain why it was chosen any other number of potential alternatives.
Lead times and deployment frequency are measures of software delivery performance tempo. However, we wanted to investigate whether teams who improved their performance were doing so at the expense of the stability of the systems they were working on.
Cluster analysis was used to group responses. Cluster analysis categories data without bias: an algorithm attempts to minimize the distance between all cluster members and maximize differences between clusters.
We applied cluster analysis in all four years of the research and found that every year, there were significantly different categories of sotware delivery performance in the industry. We also found that all four measures of software delivery performance are good classifiers and that the groups we identified in the analysis—high, medium, and low performers—were all significantly diferent across all four measures.
Other findings:
- There is no tradeoff between improving performance and achieving higher levels of stability and quality. High performers do better at both.
- Over the last few years, the high-performing cluster is pulling away from the pack. High performers are improving their performance faster than low performers.
- In 2016, change fail rate was worse for medium performers than low performers. There is no conclusive explanation for this.
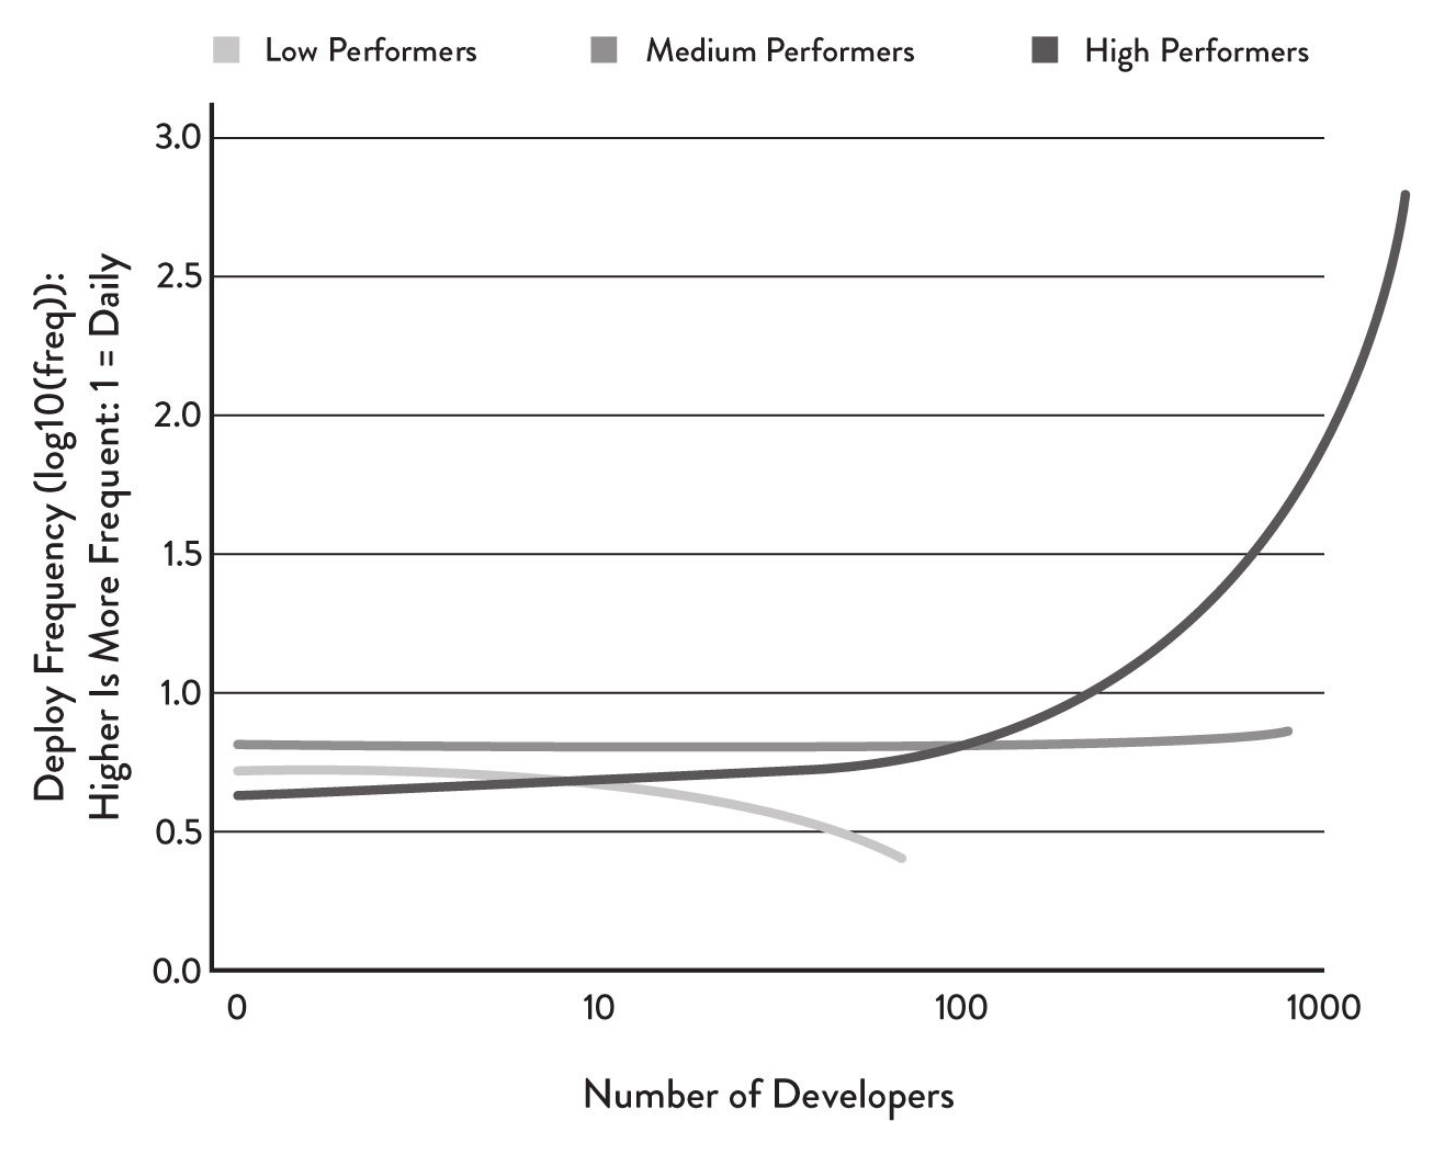
As number of developers increase:
- Low performers deploy with decreasing frequency.
- Medium performers deploy at a constant frequency.
- High performers deploy at a significantly increasing frequency.
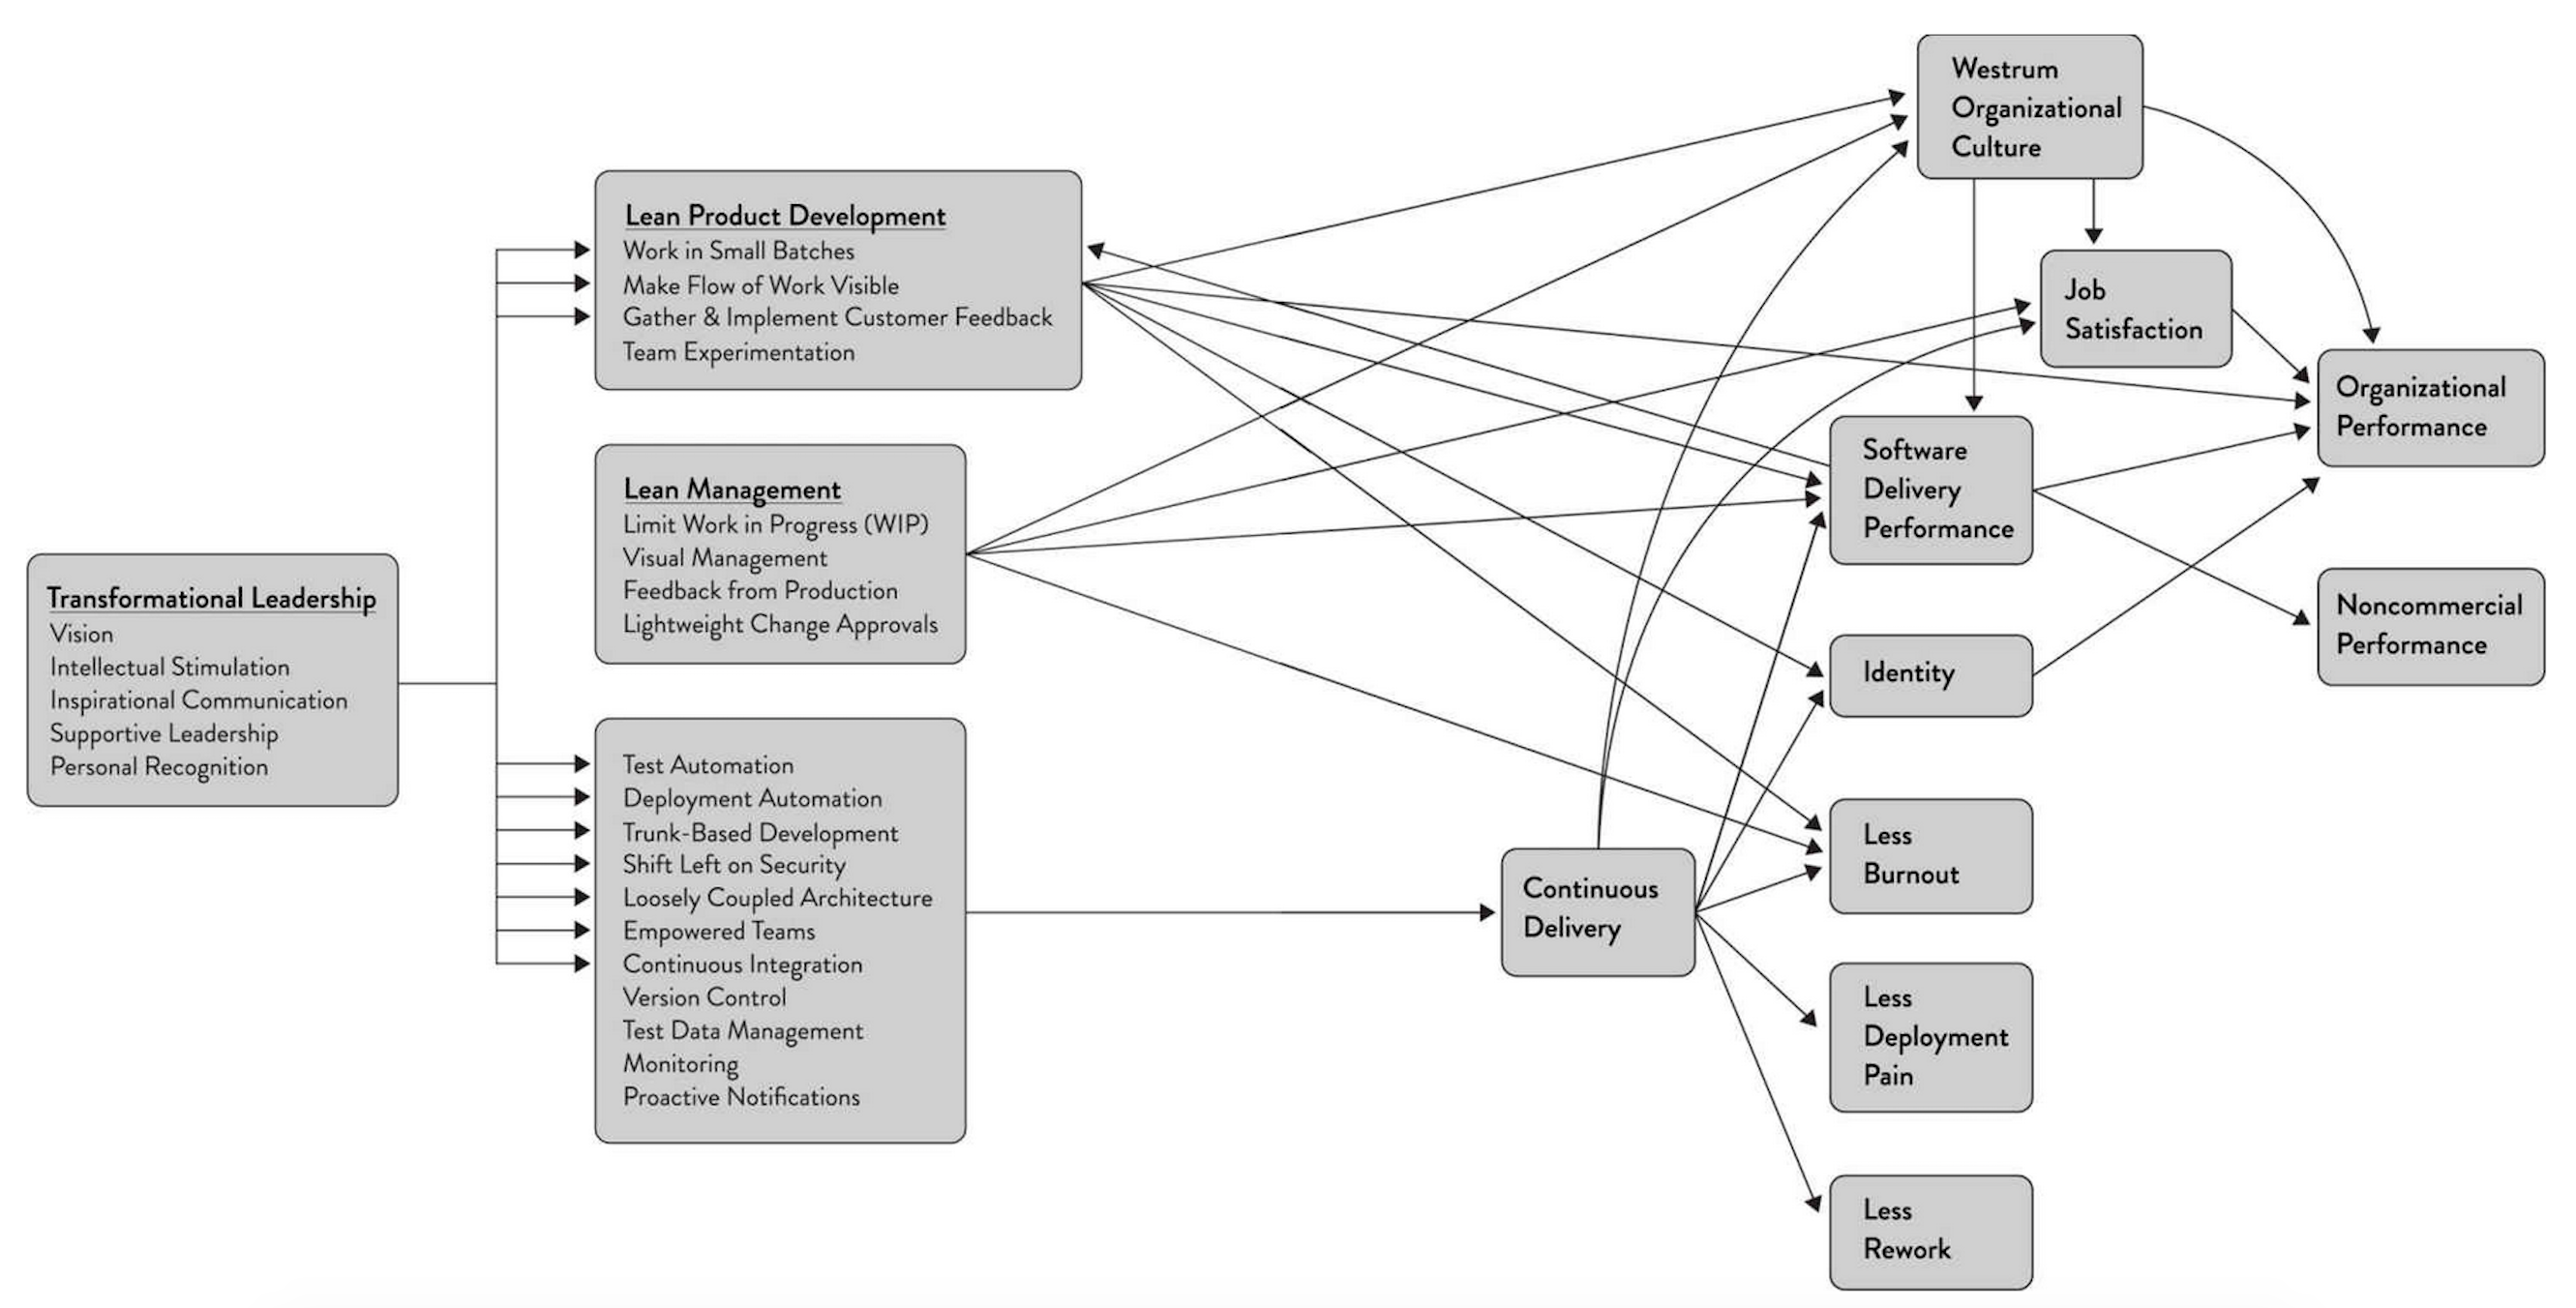
Impact of software delivery performance on organizational performance
Survey respondents were asked to rate their organization's relative performance on profitability, market share, and productivity using a validated scale of organizational performance (Widener 2007). This measure of organizational performance has also been found to be highly correlated to measures of ROI throughout economic cycles.
High-performers are twice as likely to exceed organizational performance goals as low performers.
Based on a follow study, high performers had 50% higher market cap growth over three years compared to low performers.
Research also explored how IT performance affects organization's broader organizational goals (noncommercial) beyond simple profit and revenue. To measure noncommercial goals, we used a scale that has been validated multiple times (Cavalluzzo and Ittner 2004).
TODO: Do more research on this measurement methods for organizational performance.
High performers were twice as likely to exceed objectives in quantity of goods and services, operating efficiency, customer satisfaction, quality of products or services, and achieving organization or mission goals.
Software delivery predicts organizational performance and noncommercial performance. This provides an argument for avoiding outsourcing development of software that is strategic to your business. This topic is dealt with at length by Simon Wardley, creator of the Wardley mapping method (Wardley 2015).
These metrics must be used carefully. Deming said "whenever there is fear, you get the wrong numbers" (Humble et al. 2014, p. 56). Before measuring and scientifically improving performance, you need to make sure you are also checking and improving your culture.
The most important characteristic of high-performing teams is that they are never satisfied: they always strive to get better. High performers make improvement part of everybody's daily work.
Measuring culture
Culture is intangible and there are many definitions and models.
Ron Westrum defined a model while researching human factors in system safety in domains such as aviation and healthcare. His research found that culture predicts the way information flows through an organization, as well as performance outcomes.
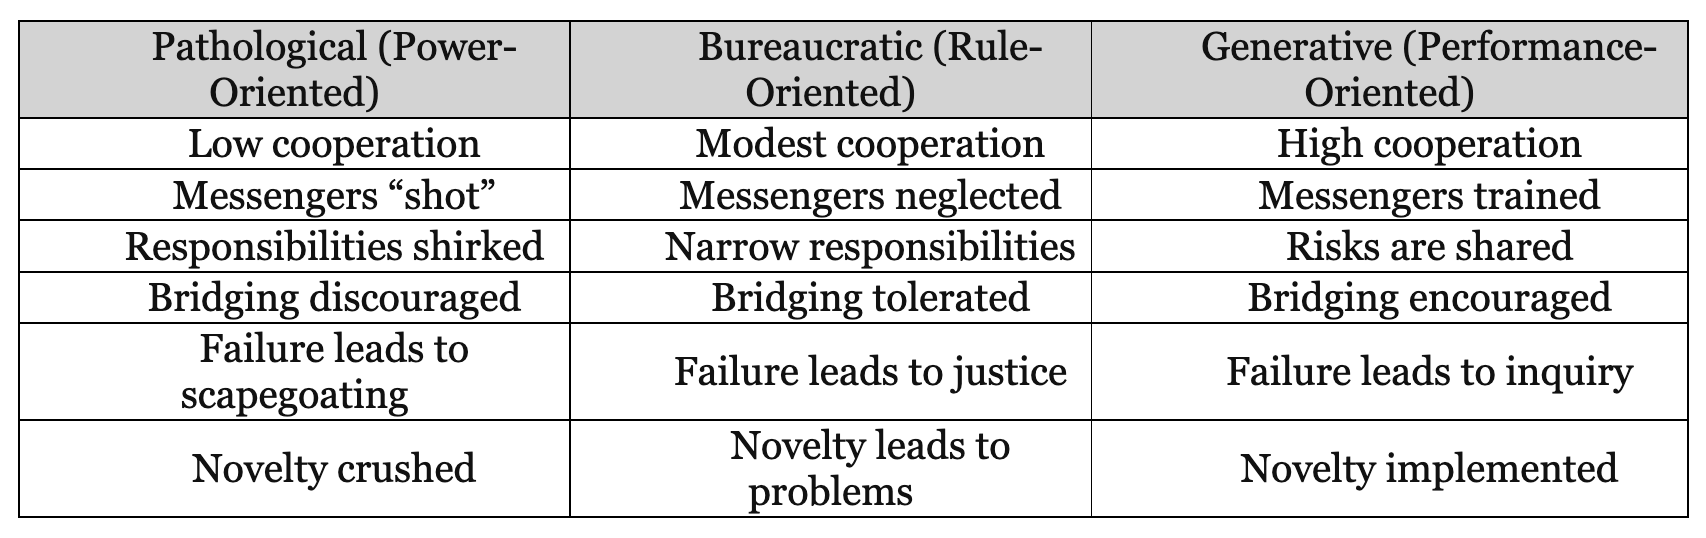
In 1988, he developed a typology of organizational culture (Westrum 2014):
- Pathological (power-oriented) organizations are characterized by largs amounts of fear and threat. People hoard and withhold information for political reasons, or distort it to make themselves look better.
- Bureaucratic (rule-oriented: organizations protect deparments. Departments want to maintain their "turf". insist on their own rules, and generally do things by the book–their book.
- Generative (performance-oriented organizations focus on the mission and goals. Everything is subordinated to good performance, to doing what we are supposed to do.
These types form "points on a scale... a 'Westrum continuum" (Westrum 2014) which makes it an excellent candidate for Likert-type questions.
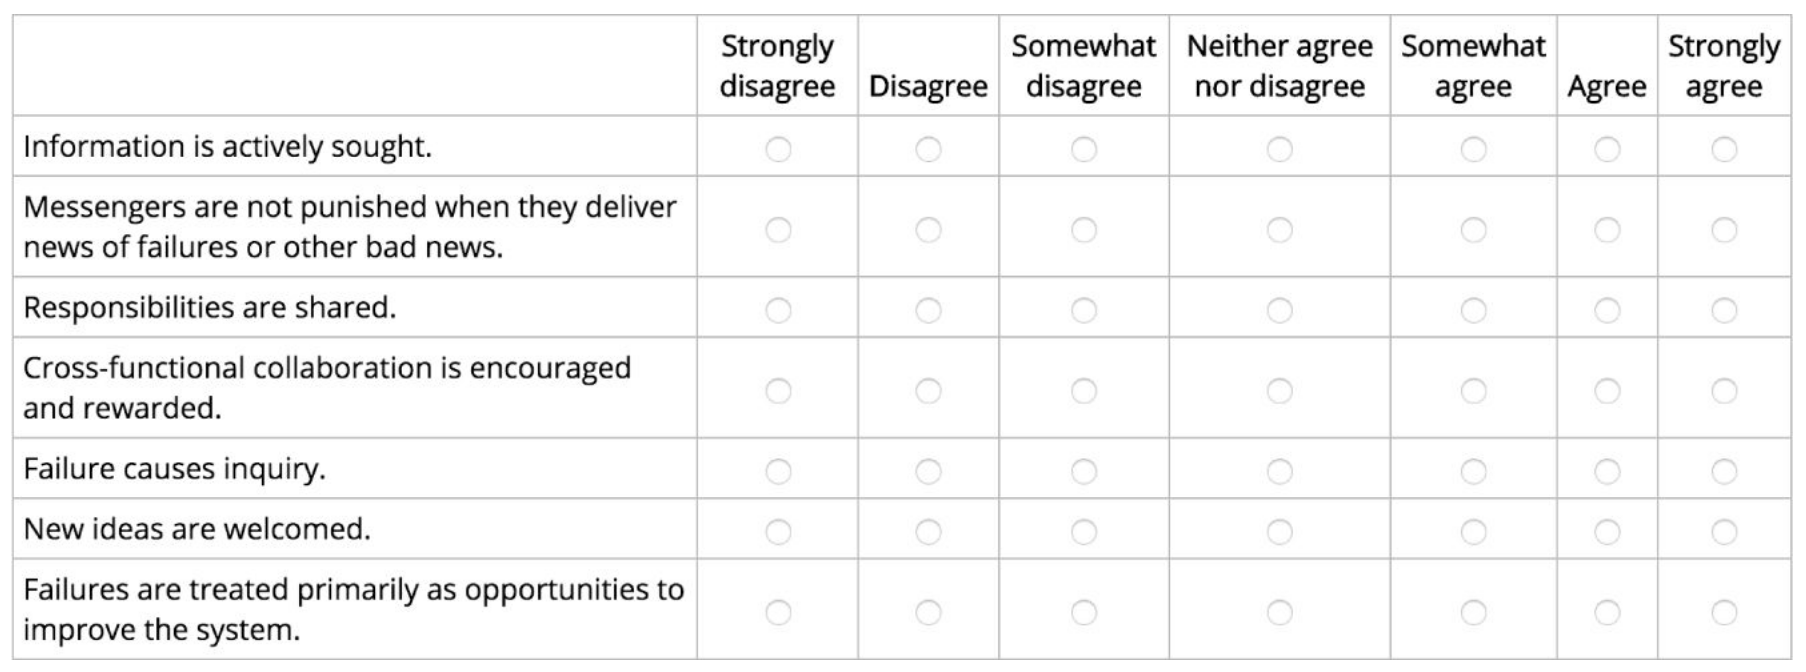
For this approach to work, the statement must be worded strongly, so that people can strongly agree or disagree about it... Once we have the responses, we need to determine if our measure of organizational culture is valid and reliable... if the questions are being understood similarly by respondents, and if, taken together, they are actually measuring organizational culture. If statiscal tests confirm validity and reliability, we call what we have measured a "construct" and we can use this measure in further research, ie. determining if organizational culture predicts software delivery performance.
Analyses conducted to ensure survey measures were valid and reliable:
- Discriminant validity: making sure that items that are not supposed to be related are actually unrelated (e.g., that items we believe are not capturing organizational culture are not, in fact, related to it).
- Convergent validity: making sure that items that are supposed to be related are actually related (e.g., that measures for measruing organizational culture actually do measure it).
- Reliability: making sure the items are read and interpreted similary by those who take the survey. Also referred to as internal consistently.
Our research has consistently found our Westrum construct–an indicator of the level of organizational culture that prioritizes trust and collaboration in the team–to be both valid and reliable.
In organizations with a generative culture, people collaborate more effectively and there is a higher level of trust both across the organization and up and down the ehierarchy. "Generative culture emnphasizes the mission, an emphasis that allows people involved to put aside their personal issues and also the departmental issues that are so eivident in bureaucratic organizations. The mission is primary. And third, generativity encourages a 'level playing field, in which hierarchy playes less of a role'" (Westrum 2014, p. 61).
We hypothesized that culture would predict both software delivery performance and organizational performance. We also predicted that it would lead to higher levels of satisfaction. Both of these hypotheses proved to be true.
Mirrors two-year research study by Google to discover factors among best-performing teams, conducting "200+ interviews... looking at more than 250 attributes of 180+ active teams" (Google 2015). Found that "who is on a team matters less than how the team members interact, structure their work, and view their contributions" (Google 2015).
Practices to improve culture
John Shook, describing his experiences transforming culture of the teams at a car manufacturing plant which was the genisis of the Lean manufacturing movement, wrote, "what my... experience taught me that was so powerful was that the way to change culture is not to first change how people think, but instead to start by changing how people behave—what they do" (Shook 2010).
Team practices were measured in the form of constructs, using Likert-type questions, ie. a Likert sacle for a statement like "Our application code is in a version control system."
Trunk-based development: research found that developing off trunk/master rather than long-lived feature branches was correlated with higher delivery performance. Short-lived branches that are merged into trunk at least daily is ok (p. 55).
Use this in GitHub whitepaper.
Allowing teams to choose their own tools: tool choice contributes to software delivery performance. Studies suggest that the upsides of delegating tool choice to teams may outweigh the disadvantages. When tools provided actually make life easier for the engineers who use them, they will adopt them of their own free will. This is a much better approach than forcing them to use tools that have been chosen for the convenience of other stakeholders (p. 66). One of the major contributors to job satisfaction is whether employees feel they have the tools and resources to do their job (p. 126).
Measuring deployment pain
Deployment pain–the fear and anxiety that engineers feel when pushing code into production–can tell us a lot about a team's software delivery performance (p. 91).
Created a measure to capture how people feel when code is deployd: asked respondents if deployments were feared, disruptive in their work, or in contrast, if they were easy and pain-free.
Statistical analysis revealed a high correlation between deployment pain and software delivery performance, organizational performance, and culture.
Measuring burnout
Christina Maslach, a professor of psychology at UC Berkeleye and pioneering researcher on job burnout, found six organizational risk factors that predict burnout (Leiter and Maslach 2008):
- Work overload: job demands exceed human limits.
- Lack of control: inability to influence decisions that affect your job.
- Insufficient rewards: insufficient financial, institutional, or social rewards.
- Breakdown of community: unsupportive workplace environment.
- Absence of fairness: lack of fairness in decision-making processes.
- Value conflicts: mismatch in organizational values and individual's values.
Measured burnout by asking respondents:
- If they felt burned out or exhausted. Many of us know what burnout feels like, and we're often exhausted by it.
- If they felt indifferent or cynical about their work, or if they felt ineffective. A classic hallmark of burnout is indifference and cynicism, as well as feelings that your work is no longer helpful or effective.
- If their work was having a negative effect on their life. When your work starts negatively impacting your life outside of work, burnout has often set in.
Five factors most correlated with high levels of burnout: organizational culture, deployment pain, effectiveness of leaders, organizational investments in DevOps, and organizational performance (p. 97).
Measuring employee satisfaction
Every good manager knows the importance of hiring, retaining, and engaging our workforce. Yet there is still a lack of information on how to measure these outcomes and what impacts them.
Employee engagement and satisfaction are indicative of employee loyalty and identity, can help reduce burnout, and can drive organizational outcomes (p. 101).
Employees at high-performing organizations were 2.2 times more likely to recommend their organization as a great place to work.
Research has shown that "companies with highly engaged workers grew revenues two and a half times as much as those with low engagement levels" (Azzarello et al. 202).
More on eNPS @ https://www.netpromotersystem.com/about/employee-nps
Employee engagement is not just a feel-good metric–it drives business outcomes.
Measuring employee identity
When leaders invest in their people and enable them to do their best work, employees identify more strongly with the organization and are willing to go the extra mile to help it be successful This results in higher levels of performance and productivity.
Measured extent to which survey respondents identify with the organizations they work with Likert questions (adapted from Kankanhalli et al. 2005):
- I am glad I chose to work for this organization rather than another company.
- I talk of this organization to my friends as a great company to work for.
- I am willing to put in a great deal of effort beyond what is normally expected to help my organization be successful.
- I find that my values and my organization's values are very similar.
- In general, the people employed by my organization are working toward the same goal.
- I feel that my organization cares about me.
You can average the five item scores together into a single score for a person's identity.
Measuring transformational leadership
Role of leadership on technology transformations has been one of the more overlooked topics in DevOps.
"Transformation leadership" means leaders inspiring and motivating followers to achieve higher performance.
To capture transformation leadership, used a model that includes five dimensions (Rafferty and Griffin):
- Vision. Has a clear understanding of where the organization is going and where it should be in five years.
- Inspirational communication. Communicates in a way that inspires and motivates, even in an uncertain or changing environment.
- Intellectual stimulation. Challenges followers to think about problems in new ways.
- Supportive leadership. Demonstrates care and consideration of followers' personal needs and feelings.
- Personal recognition. Praises and acknowledges achievement of goals and improvements in work quality; personally compliments others when they do outstanding work.
Measured transformational leadership using survey questions adapted from Rafferty and Griffin (2004):
There's a pattern of measurement–identifying a research-based model, converting it into a survey, and then testing for validity and reliability.
My leader or manager:
(Vision)
- Has a clear understanding of where we are going.
- Has a clear sense of where he/she wants our team to be in five years.
- Has a clear idea of where the organization is going.
(Inspirational communication)
- Says things that make employees proud to be a part of this organization.
- Says positive things about the work unit.
- Encourages people to see changing environments as situations full of opportunities.
(Intellectual stimulation)
- Challenges me to think about old problems in new ways.
- Has ideas that have forced me to rethink some things that I have never questioned before.
- Has challenged me to rethink some of my basic assumptions about my work.
(Supportive leadership)
- Considers my personal feelings before acting.
- Behaves in a manner which is thoughtful of my personal needs.
- Sees that the interests of employees are given due consideration.
(Personal recognition)
- Commends me when I do a better than average job.
- Acknowledges improvement in my quality of work.
- Personally compliments me when I do outstanding work.
These characteristics of transformation leadership are highly correlated with software delivery performance and eNPS (p. 119).
Transformation
Enterprise leaders ask: How do we change our culture? Better questions to ask are: How do wel earn how to learn? How do I learn? How can I make it safe for others to learn? How do we, together, establish new behaviors and ways of thinking that build new habits?
You can't "implement" culture change. Implementation thinking (attempting to mimic another company's specific behavior and practices) is, by its very nature, counter to the essence of generative culture.
Don't look to copy other enterprises on their methods and practices, or to implement an expert-designed model. Study and learn from them, but then experiment and adapt to what works for you and your culture.
Don't contract it out to a large consulting firm–your teams will not develop the capability to continually improve on their own. Develop your own coaches, you must be the agent of your own change.
Leaders need to change their way of work too. A generative culture starts with demonstrating new behaviors, not delegating them.
A high-performance culture is far more than just the application of tools, the adoption of a set of interrelated practices, copying the behaviors of other successful organizaations, or the implementation of a prescribed, expert-designed framework. It is the development, through experimentation and learning guided by evidence, of a new way of working together that is situationally and culturally appropriate to each organization.
The stats-y stuff
Likert-type surveys are quantitative research, not qualitative (p. 132).
Levels of analysis (in order of increasing difficulty:
- Descriptive: summarizing and reporting collected data, ie. vendor reports about the state of tool usage in an industry.
- Exploratory: looks for relationships among the data–identify correlation (but not causation).
- Inferential predictive analysis: helps understand impact of one variable on another. To avoid problems with "fishing for data" and finding spurious correlations, hypotheses must be based on a well-developed and well-supported theory. Some might ague that theory-based design opens us up to confirmation bias, this is how science is done.
- Predictive: used to predict, or forecast, future events based on previous events.
- Causal: considered the gold standard, but is "the most difficult analysis to conduct for most business and technology situations. This type of analysis generally requires randomized studies."
- Mechanistic: calculates the exact changes to make to variables to cause exact behaviors that will be observed under certain conditions.
[Predictive, causal, and mechanistic analysis] were not included in our research because we did not have the data necessary for this kind of work.
Classification analysis, or clustering, may be considered an exploratory, predictove, or even causal analysis. How it worked: the four performance variables were put into the clustering algorithm which yielded groups.
We used hierarchical clustering... we didn't have any theoretical or other ideas about how many groups to expect prior to the analysis... allowed us to investigate parent-child relationships in the emerging clusters, giving us greater interepretability.
==Nicole: "As you increase the number of clusters you have less explainability. But 2 clusters isn't interesting. Sometimes the jump from 2 to 3 is not as interesting or explainable as 5. We used hierarchical because you go from 2 to 3 or 3 to 4, a cluster splits in half which gives you more explainability. Wards' method makes sure sure membership in each cluster is populous so you don't end up with a cluster of 1. Cluster analysis yields the groups which gives you a big table. These 4 dora metrics are predictive of cluster membership AND cluster membership is evenly distributed AND how do I see 'high', 'medium', 'low'? Run an ANOVA (like a t-test but for more than one variable) and it tells you what is higher or lower than another. It is not typical for cluster analysis to be consistent across properties and to neatly fall into "high", "medium", "low". This was surprising and remained consistent each year thereafter (and each year they started from scratch).=
Pyschometrics
Bad surveys are found all over (p. 144), common weaknesses are leading questions, loading questions, multiple questions in one, and unclear language.
Single question surveys ("quick surveys") can be OK if they are well-written and carefully understood questions, like NPS.
Latent construct = a way of measuring something that can't be measured directly, ie. you can't take go take the "temperature" of a team's organizational culture–"we need to measure culture by measuring its components parts (called manifest variables)... through survey questions" (p. 146).
When working with latent constructs, it is important to start with a clear definition or model for what we want to measure (like Westrum's typology of organizational culture).
We can ask one question for each manifest variable–using separate questions shields you against:
- bad measures by giving us several views which helps eliminate rogue data, and
- bad actors by making it more difficult for a single bad data source–whether through misunderstanding or bad actor–source to skew results.
See p. 224 - 229 for detailed descriptions of methods for validity, relability, relationships and clustering.
Snowball sampling was used, which is a form of nonprobability sampling.
Why use surveys?
- Surveys allow you to collect and analyze data quickly.
- Measuring the full stack with system data is difficult.
- Measuring completely with system data is difficult.
- You can trust survey data.
- Some things can only be measured through surveys.